


Updates and New Maps
New stuff for a New Year!

First post of 2021! Today I wanted to share some updates on old maps, talk about my projects and goals in the spirit of the New Year, and show what I’ve been working on.
After I sent Randy my map from Hexbin Maps and Choropleths, he fixed it up a bit and here is the final version.
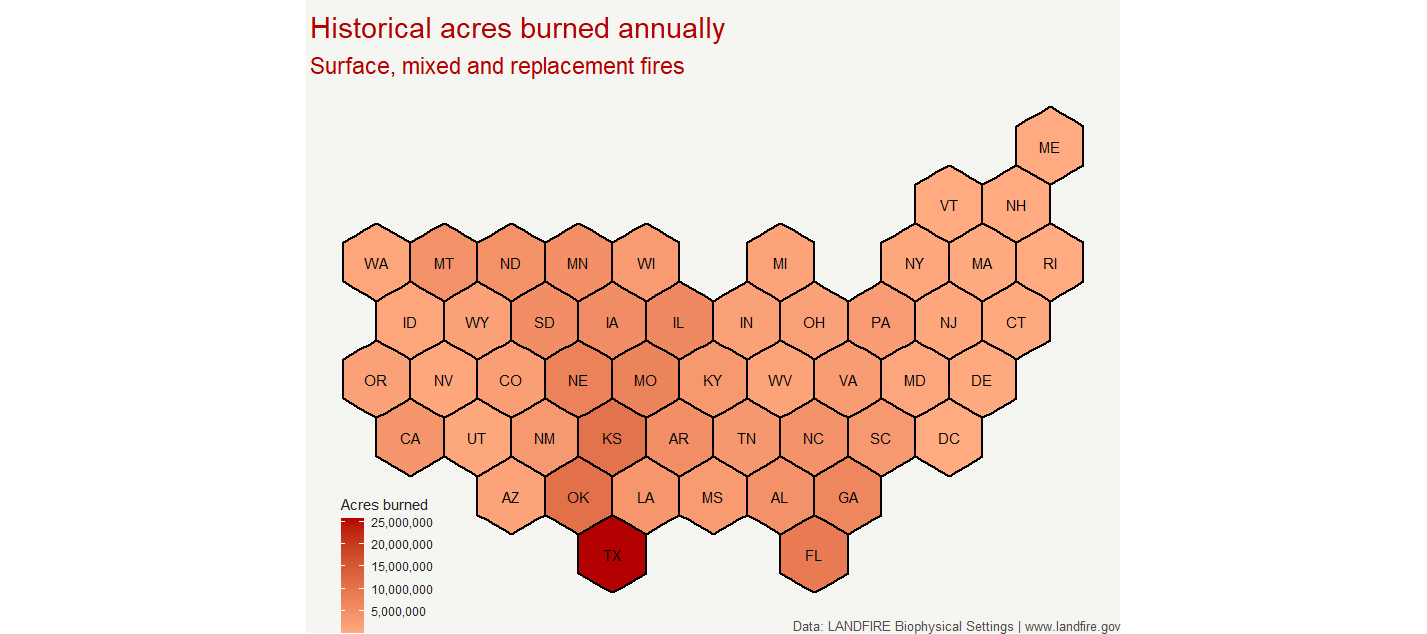
Definitely looks a lot better, and I hope to keep improving.
As for the my leaRning goals (stole that from Randy) for this year, here’s a snippet of what I was thinking:
“Overall, I want to learn more about what I can do in R because I don’t even know all the cool things I could work on! That being said, I’d definitely like to improve my mapping abilities and customize my blog more. I want to explore different packages for R (parallax is a good example) and learn about new cool ways of presenting data. I would love to narrow in more on a project (maybe Anna’s) if that would be helpful. Honestly I’m pretty open to just try more things!”
That was my sentiment from mid-December and it basically sums it up. I haven’t even learned about half the cool things I’ll want to learn. However, I’ve been reading The Truthful Art by Alberto Cairo and that’s giving me a taste.
Now that I’ve talked about the past and future goals, what about the present?
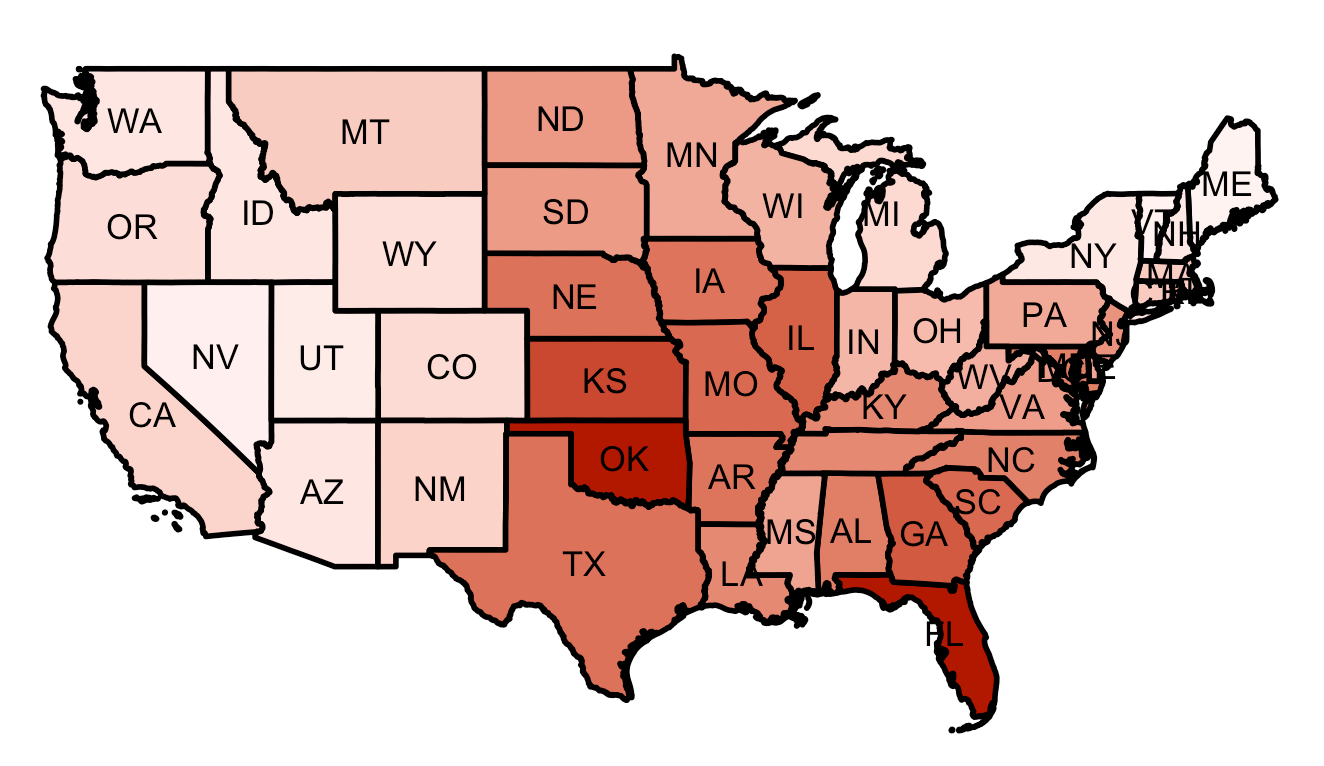
Well, today I was working on my first-ever choropleth with state boundaries. I used a json shapefile from Eric Celeste Tech (cool name!), but it included Hawaii, Alaska and Puerto Rico so I had to manually remove them. By that I mean I just selected and deleted a whole chunk of their spatial data. Definitely not the best way but it worked!
I also had to manually input the state initials, since they weren’t included in the dataset, and I couldn’t figure out how to make them smaller.
After that I used ggplot to graph based on some code that Randy used when he made a ggplot hexbin choropleth. The only issue with using ggplot for a choropleth is that, to my knowledge, it can’t make interactive maps, so I’ll need to do it all over again in leaflet. But it was still really good practice.
I started remaking the graph using leaflet, but I hit an issue while following the R Graph Gallery tour. Maybe that’s for next time.


Share this post
Twitter
Google+
Facebook
Reddit
LinkedIn
StumbleUpon
Pinterest
Email